Big Data, Analytics and Reflections on Student Success
Published by: WCET | 11/6/2014
Tags: Data And Analytics, Student Success, WCET Annual Meeting
Published by: WCET | 11/6/2014
Tags: Data And Analytics, Student Success, WCET Annual Meeting
Today we feature Ellen Wagner, Chief Strategy Officer, Predictive Analytics Reporting (PAR) Framework as she takes us on a tour of the post-secondary big data landscape, including reflections on the first three years of the PAR Framework.
It Begins With Big Data
One of the surest signs that a technology trigger is starting its roller-coaster ride through the (Gartner) Hype cycle of innovation is when the name we all call that trigger becomes a part of the public lexicon.
Today, Big Data is an all-encompassing term used to describe data sets so large and complex that it becomes difficult to process using traditional data processing applications. A quick search of Google Trends shows that references to Big Data started to appear in web references, literature, and popular press back in 2007, after Tom Davenport and Jeanne Harris published their book Competing on Analytics: The New Science of Winning (Harvard Business Review, 2007). Today, after only seven years, a Google search on Big Data will result in more than 857 million search results being surfaced. Big Data is so pervasive as an idea that it has become a meme, standing for something even bigger and more transformative than the data themselves. The term has come to stand for the idea that the records of activity that we leave in the path of our various digital engagements is just waiting to be mined by service providers, beacons, and embedded code strings, all in the service of optimized, personalized experience.
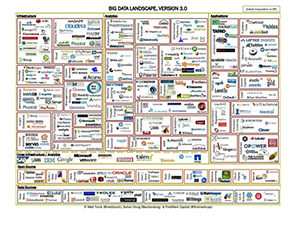
 This Big Data Landscape 3.0 graphic by Matt Turck et al provides a high level visual representation of the breadth and complexity of the Big Data landscape. What is notable about this particular depiction is that very few of the companies in this graphic have very much to do with providing products and services for the post-secondary educational market in the United States. Some of the larger firms do have education lines of business, but these exist as part of a product company’s vertical market strategy rather than being explicitly aimed at big data services in education. The explanation for this apparent oversight is a simple one. Although Big Data has certainly ramped up expectations of accountability and transparency in higher education settings, most of the data driving decision-making in higher education comes to us in columns and rows. Data sets that present in columns and rows can certainly be massive in number; however, data reported in columns and rows is still too small to be considered a true Big Data asset.
Nevertheless, meme of Big Data has been an effective catalyst to help people start to imagine what it will take to move away from authority-driven decision-making in post-secondary education and to establish a culture of evidence-based decision-making. But at a more systemic level, the ability to leverage insights to anticipate opportunities for optimizing effectiveness will be one of the key attributes demonstrated by data-savvy organizations and enterprises. How we license our digital textbooks will have everything to do with data related to use and student performance; the design of adaptive and personalized experiences will all depend upon data to filter, aggregate, assemble and exchange content, assessments and engagements.
Learner Analytics
So it should be no surprise that interest in learner analytics – predictive, inferential and descriptive alike – has grown steadily in recent years. The Learning Analytics and Knowledge conferences provided a venue for exploring dimensions of learning analytics research. The Society for Learning Analytics Research (SoLAR) helps explore the role and impact of analytics on teaching, learning training and deve lopment. Purdue University’s Signals was among the first examples of using predictive analytics to identify students at risk, using a simple green – orange – red color scheme to flag students according to their risk probabilities. Sinclair College’s Student Success Plan provided early predictive case management support in the category for what is now emerging as Integrated Planning and Advising Systems (IPAS) tools and platforms. Rio Salado College used their PACE system to anticipate students at risk. Austin Peay University’s Degree Compass gave people an Amazon-like experience for course selection. Institutions including the American Public University System and the University of Phoenix made significant advancements in building sophisticated predictive analytics models to find students at risk. But it was the Bill & Melinda Gates Foundation’s investments in action analytics which helped jump-start and sustain multiple initiatives focused on building capacity to support using data to support and enable decision-making. In the post-secondary educational arena, these include Achieving the Dream , Completion by Design, as well as multiple waves of Next Generation Learning Challenges awards. PAR, the Predictive Analytics Reporting Framework , received its first of several round of funding from the Gates Foundation in May, 2011.
PAR – From a Big Audacious Idea to a Collaborative, Non-Profit Venture
 For the past three years the PAR Framework core staff and institutional members have created one of the largest student outcomes data resources ever assembled, from the voluntary contributions of de-identified student record from each of our member institutions. We learned very early on that the common data definitions created to facilitate the exchange of records also provided us with the lexicon required for talking with one another about student risk, persistence, and success between and within institutions. We provide members with comparative benchmark reports. We provide localized predictive models generate a risk score for each (de-identified) student in the sample for each of our member institutions, and with access to dashboards for student watch-lists for designated professional staff including advisors and faculty.
The PAR Student Success Matrix (SSMX) then helps institutions comprehensively assess their student success policies, interventions and programs by organizing the wide variety of student supports – from orientation to mentoring to advising – into a systematic validated framework designed to quantify the impact of student success practices and determine the best support for students at the point of need. The SSMx also reveals gaps and overlaps in student support programs and gives institutions the tools to evaluate the efficacy of their investments at the program level. The common PAR measures for assessing and predicting risk and the validated frameworks categorizing student support services create the mechanism to effectively measure the impact of student supports within and across institutions.
Reflections
I was recently asked if I have been surprised by any of the things we have learned as PAR has evolved from a big audacious idea into being a learner analytics as a service provider for our members. I allowed that I have had three big surprises.
The PAR Framework community is actively looking for forward-thinking institutional partners to join us in our efforts to launch a culture of evidence based decision-making in the service of student success. Please join us in Portland to learn more about becoming a part of the PAR community.
Ellen Wagner, Chief Strategy Officer
PAR Framework